inverse square of distance...
| CLICK on images below to access full-scale graphs | ||
 |
 |
 |
we work in a partially darkened room, using an halogen desk lamp (the more powerful the lamp, the least lightproofing we need for the room!)
We set the lamp vertically (it is a small-bulb type, with a reasonably wide angle; a naked small halogen lamp would be the best,
resting it on a table, and line up tables over a length of approx. 3m (the longer the better)
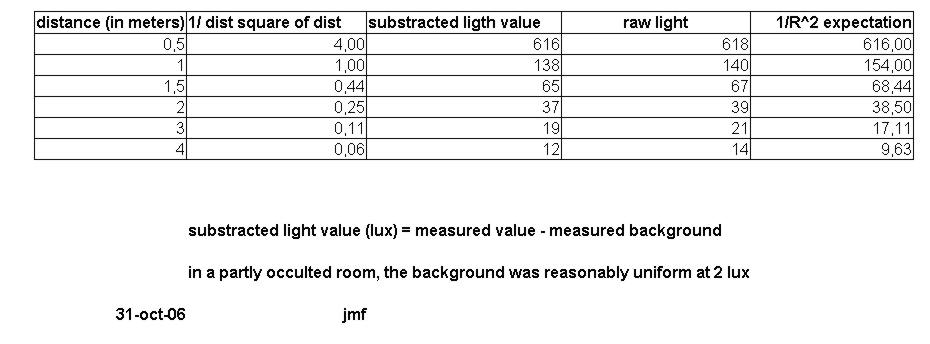
We measure the light intensity at fixed distances: 0.5, 1, 1.5,2,3,4 m for instance (better not to get too close to the lamp,
where details of the source and reflector would bias the measurement.
We then repeat the measurement with the light off (to measure the background and subtract it). In principle, this must be done at each point. In our case (it was late afternoon, and , although the curtains were far from perfect, we got a uniform background of 2 lux).
The background (beam-off) value is then subtracted from the raw measurement.
The lower the background, and the more powerful the lamp, the further away you can conduct the experiment. Pay attention however to the
fact that a very powerful lamp in a small room with light walls or ceilings will induce an important reverberation: a more directional sensor would then be needed.
This offers an interesting discussion about "background substraction" and the resulting errors !
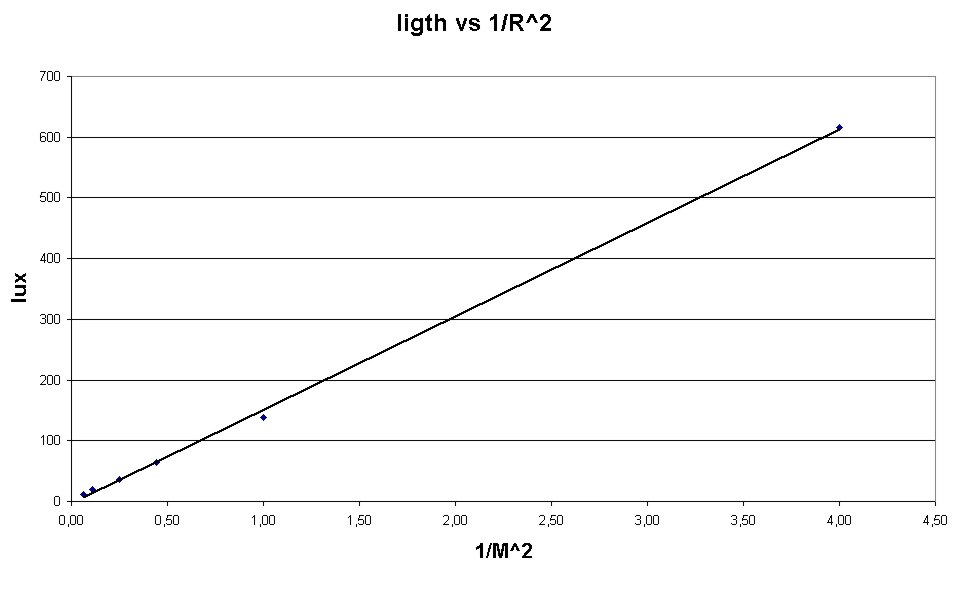
The graphs (click on the thumbsize prints at the top of this page) speak for themselves.
The decrease of the light intensity according to the inverse-square of the distance to the source is well verified:
- as seen from the numerical table, where we have calculated 1/r^2, and adjusted to the light level (compare the columns "substracted ligth value" and "1/R^2 expectation"
- as seen from the plot of LIGHT vs (1/R squared), showing a straight line. This graph however suggests that more points between 0.5 and 1m would have been of use (there is a long gap on the horizontal scale)
- as seen from the plot of LIGHT vs DISTANCE, where we have added a power-law fit: this shows the power of R to be (-1.89) , reasonably close to the (-2) expected.