in Polarised light
|
||||||
It uses cheap equipment, (total cost approx 60 euro), and is easy to perform in daylight (-- it uses daylight)
The accuracy is good (a few percent)
Indeed it illustrates:
- The VECTOR nature of light (characterized by the Electric field E)
- The projection of such vectors in various directions
- The "square of the amplitude" dependence of the energy, characteristic of wave mechanics (and later of quantum mechanics)
- It relates the square of the amplitude in wave formulation to the electrical energy,
- It is a crucial link to serious Quantum Mechanics courses.
- the polarisation states,
- the projection operation operated by filters
are used as the standard analogy in the DIRAC formulation of quantum mechanics, (at the basis of quantum field theory),
see for instance the classical ref :
- Dirac, P. A. M., 1930, The Principles of Quantum Mechanics, Oxford: Clarendon Press.
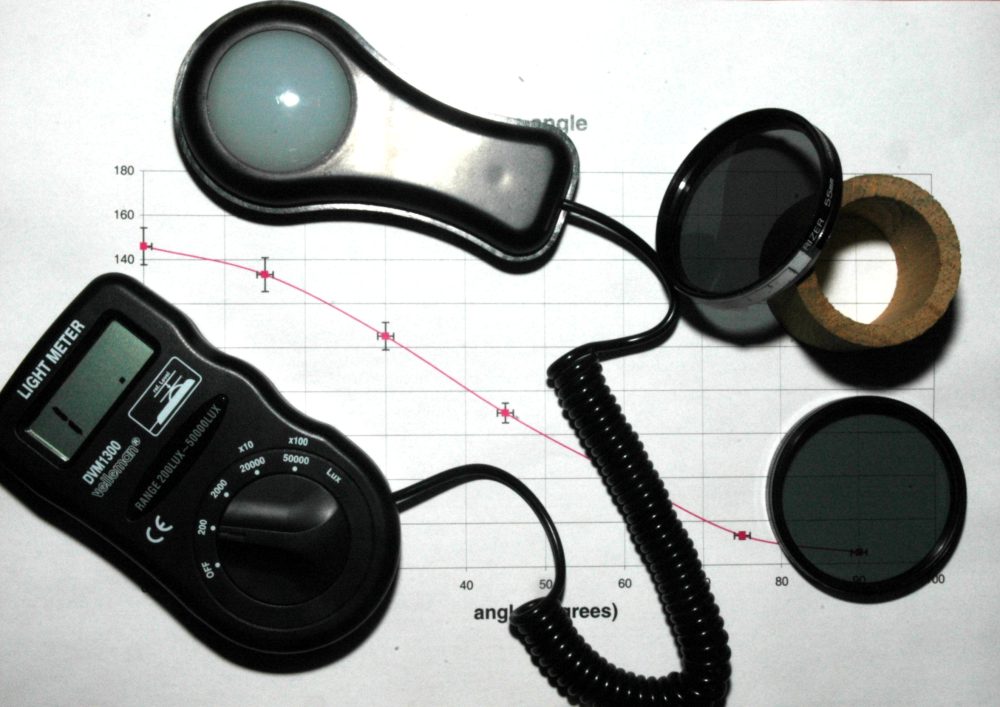
- light-meters are now cheaply available (mine is imported by Velleman, and costs about 50 euros).
- A pair of linear polarisers can be obtained in rotating mount from (used) photo shops: they no longer work with autofocus or light measurement in the latest SLRs (where they are replaced by circular polarisers) : the price is negligeable
Alternatively, cheap linear polarising filters (plastic) can be obtained from standard physics suppliers.
- A tube is used to adapt the filters on the light-measuring element: this can be anything opaque (like plastic drain pipe, heavy cardboard tubes, ...)
The zero setting may be chosen arbitrarily, but as a matter of elegance, it is convenient to fix it using the Brewster angle (see below)
This is easily realised on the optical bench, by placing the polariser in its rotating mount on the light source, and fitting a piece of black glass on a goniometer.
It is however very easily demonstrated in the class room by looking at a set of windows from a nearby building (in the horizontal plane). One window will likely be close to the Brewster angle, and rotating the filter will kill the reflected light: at this moment, the filter is only allowing the light polarised in the incidence plane. (the Brewster angle for glass is about 56 degrees from the normal incidence).
- in principle, the measurement can be made using
only available daylight, inside a room. The light-meter has a highest
sensitivity scale reaching 199.9 lux. (with scales up to 50 000)
My first measurements in a north-facing room in fall gave a max of 50 lux, and a background (polarisers in crossed position) of 1.8 lux;
---- but clearly, a desk lamp, possibly with a coloured (not blue) filter can help.
- stack the 2 filters on top of the tube, and the
tube snuggly on the lightmeter. the filter with a scale could be on the
bottom
- rotating the other filter, check the lightmeter for the minimum of light; when this is reached, put a mark on the scale-less filter in front of the 90 degrees notch on the other
- rotate back the top filter to 0 degrees, and check that you indeed have a maximum
- measure the amount of light for various angles
(for instance, with a spacing of 15 degrees)
- put an opaque screen on top of the assembly, this allows to measure the background (light leakage), which can be substacted
- in daylight conditions : the same apparatus can be used to check 1/2 and 1/4 wavelength plates (check that the polarisation is reversed, or circular, after carefully adjusting the plates orientation)
- alternatively, precision measurements can be made
in a darkened room, using the optical bench. Since come light is needed
to read the light-meter, it may still be advisable to use the tube
set-up.
- obviously, narrow-filtered light, or
monochromatic (Na) light would be preferred, and it may also be
preferable to adapt the sensor to make it more punctual and directional
(remove the white ambiance filter, at the cost of loosing the absolute
scale)
| CLICK on images below to access
full-scale graphs |
||
 |
 |
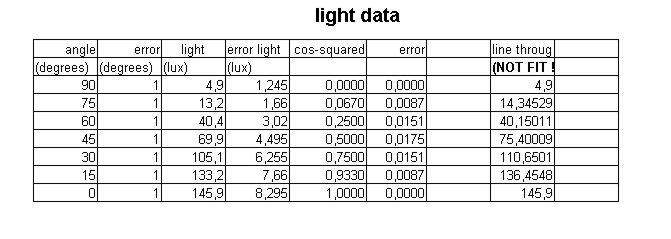 |
However, care should be taken if an automatic line fitting (least squares) is used. Many programs indeed assume equal errors (and often neglect the error on x in x-y plots). This is certainly not the case here: the error on the light measurement is typically a fraction of the measurement + a constant, while, if the cosine squared is used as a variable, the error on this quantity is proportional to 2 * sin* cos* Delta(theta) . The error is thus maximal for 45 degrees, and vanishes (at first order) for 0° and 90° , which are both local extrema of cos squared in terms of the angle.
A precise chi-squared treatment is of course possible (see http://homepages.vub.ac.be/~frere/ , under the heading general physics)
To avoid entering these more elaborate discussions for this elementary measurement, and more specifically in the framework of a demonstration, I suggest to present:
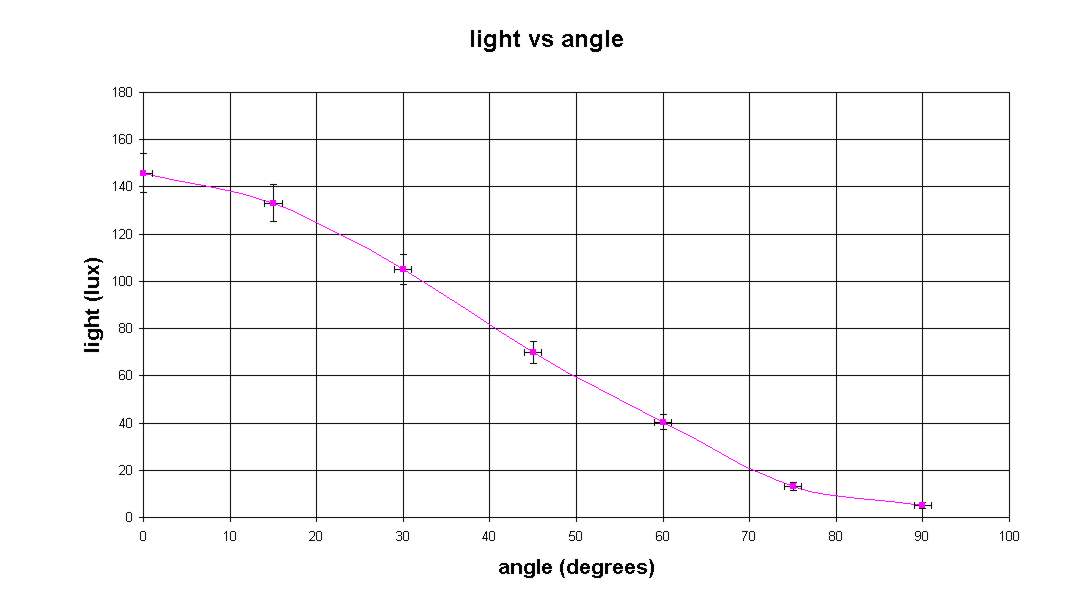
- the raw curve, with the angular dependence, and
no substraction of the background (that is: light measured vs
polarisers angle)
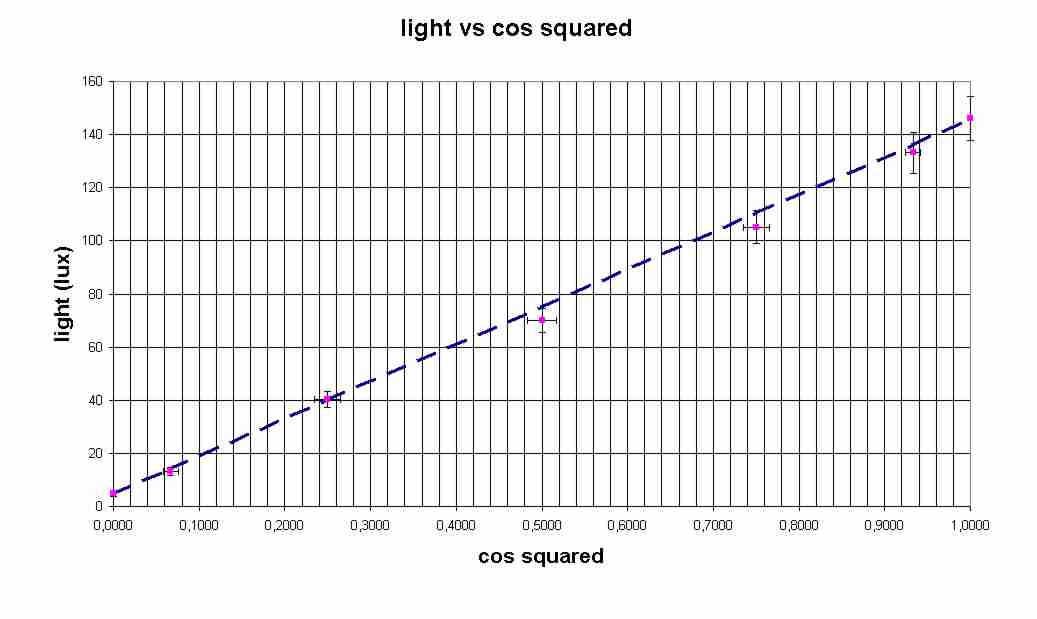
- a cos-squared vs light-measured curve, after substraction of the parasitic light remaining when polarisers are crossed (assuming thus it is fully due to leaks) : compare the intermediary points to the "stable" ones, corresponding to 0 and 90 degrees, by which a straight line is fitted
the linearity is probably much better, and will be checked in separate experiment testing the 1 over R squared behaviour.